The whole idea of the Debugger is to permit you to "watch" every detail of your game. This is done using "watch windows" which, by default, are opened in the Output window docked
at the bottom of the IDE. You can click on each of the different tabs to see the watches that they contain, some of which can be made to update in real time (when real time debugging ![]() is enabled from the Debugger toolbar) while others will require the debugger to have paused the game.
is enabled from the Debugger toolbar) while others will require the debugger to have paused the game.
When you are watching variables in any of the windows, it can be one of multiple data-types. However, due to the way that GameMaker stores certain things, the Debugger does not always know exactly what the
variable holds. This is because the internal ID values for data structures or instances are integers and so the Debugger doesn't always know if the integer value being stored in a variable is for a data structure or an instance or is
simply an integer value. For that reason, you can right click ![]() on any variable value and get a pop-up window that lists the available data-types
that this variable could be:
on any variable value and get a pop-up window that lists the available data-types
that this variable could be:
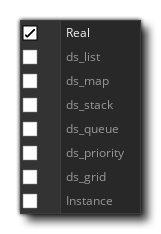 Strings and arrays do not permit this option, and it is worth noting that even if a data structure is stored in an instance variable, its ID number
is global, so if you have four instances and each one creates a ds_list (for example), each list will have an ID from 0 to 3, and they won't all be 0.
Strings and arrays do not permit this option, and it is worth noting that even if a data structure is stored in an instance variable, its ID number
is global, so if you have four instances and each one creates a ds_list (for example), each list will have an ID from 0 to 3, and they won't all be 0.
Once you have selected your data-type, the variable will then show the entries in the structure simply by clicking the small ![]() next to its name. This will expand the structures
contents, and you can also change some of the values for the variables shown by simply double clicking
next to its name. This will expand the structures
contents, and you can also change some of the values for the variables shown by simply double clicking ![]() on the value and giving it a new one.
on the value and giving it a new one.
NOTE: you cannot re-assign arrays or data structures in this way, but you can change some of their contents (you cannot change the "key" values in maps, nor the priority value for priority queues).
Below you can find a list of each of the different watch windows along with an explanation of what they are for and how to use them:
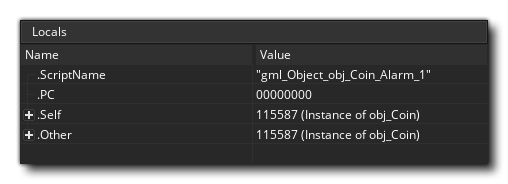 The Locals window shows the current step properties, which includes the name of the current event (or script) being
run, the offset in the Virtual Machine (VM) code for the current script (the acronym "PC" is for "program counter"), the "self" instance running
the code block, and the "other" instance in the event. This last part is only ever valid when the event is a collision event or there is a "with" used in the code. If the instance is in collision,
"other" will show the other instance (and its variables) in the collision, but if it is a with then the "Self" instance becomes that which is running the code, while "Other" is then the instance
that actually contains the with. At all other times, "other" will simply show the same data as "Self".
The Locals window shows the current step properties, which includes the name of the current event (or script) being
run, the offset in the Virtual Machine (VM) code for the current script (the acronym "PC" is for "program counter"), the "self" instance running
the code block, and the "other" instance in the event. This last part is only ever valid when the event is a collision event or there is a "with" used in the code. If the instance is in collision,
"other" will show the other instance (and its variables) in the collision, but if it is a with then the "Self" instance becomes that which is running the code, while "Other" is then the instance
that actually contains the with. At all other times, "other" will simply show the same data as "Self".
Note that the "Self" and "Other" instances can be expanded by clicking on ![]() to see a
list of all local and instance variables that are currently declared for the code block being stepped through. If you right click
to see a
list of all local and instance variables that are currently declared for the code block being stepped through. If you right click ![]() on a value you can set its type to see details of data structures.
on a value you can set its type to see details of data structures.
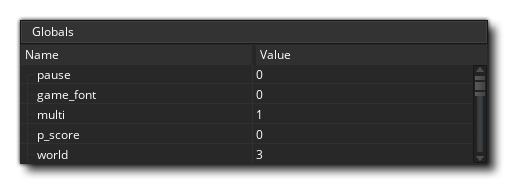 The Globals window will show a list of
all the currently declared global variables and their values. If you right click
The Globals window will show a list of
all the currently declared global variables and their values. If you right click ![]() on a value you can set its type to see details of data structures.
on a value you can set its type to see details of data structures.
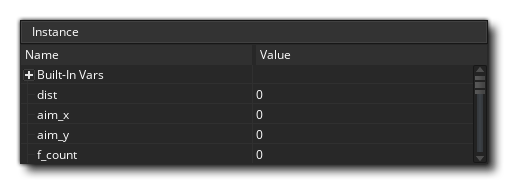
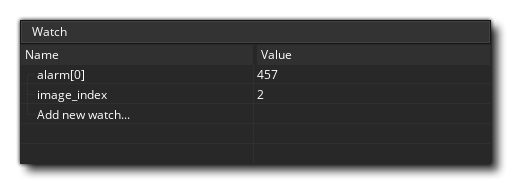 This window is for you to add a specific variable that
you want to keep track of. This can be a global or instance scope variable, a built in variable or even an array or data structure. If the the instance code being
stepped through has the watched variable it will be shown here, meaning you can easily keep track of a value without having to search for it in the Locals or Globals windows. If you right click
This window is for you to add a specific variable that
you want to keep track of. This can be a global or instance scope variable, a built in variable or even an array or data structure. If the the instance code being
stepped through has the watched variable it will be shown here, meaning you can easily keep track of a value without having to search for it in the Locals or Globals windows. If you right click ![]() on a value you can set its type, delete it, or clear all watches from the window.
on a value you can set its type, delete it, or clear all watches from the window.
 As the name implies, this window will show all instance variables,
local variables for the instance event, built in variables, and structs associated with the instance currently being stepped through in the Source window (if an instance is being referenced using
the keyword "other" or the with statement, then this window will show that instances properties instead). If you right click
As the name implies, this window will show all instance variables,
local variables for the instance event, built in variables, and structs associated with the instance currently being stepped through in the Source window (if an instance is being referenced using
the keyword "other" or the with statement, then this window will show that instances properties instead). If you right click ![]() on a value you can set its type, delete it, or clear all watches from the window.
on a value you can set its type, delete it, or clear all watches from the window.
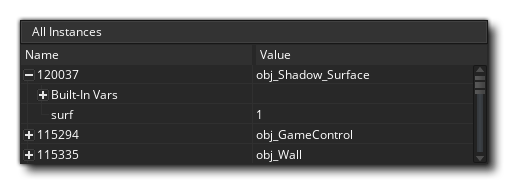 Should you need to see all instances that
are currently in the room, you can select this window and they will be listed. You can also see the state of any built in variables, instance variables or structs that they have, and you can right
click
Should you need to see all instances that
are currently in the room, you can select this window and they will be listed. You can also see the state of any built in variables, instance variables or structs that they have, and you can right
click ![]() on a value to set its type.
on a value to set its type.
Selected InstanceSelected Instance
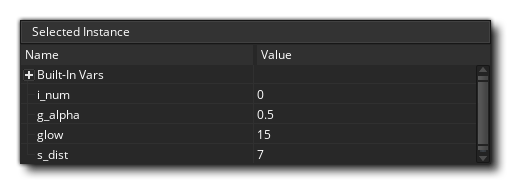 This window is for when
you select an instance from your game. This is done by simply pausing the game and then clicking on any visible instance within the game window. The instance found beneath the mouse cursor will then have its information displayed in the Selected
Instance window, where you can see it's built in variables, instance variables, and structs the same as for the Instances window.
This window is for when
you select an instance from your game. This is done by simply pausing the game and then clicking on any visible instance within the game window. The instance found beneath the mouse cursor will then have its information displayed in the Selected
Instance window, where you can see it's built in variables, instance variables, and structs the same as for the Instances window.
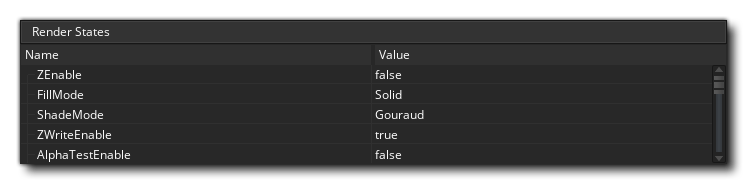 This watch shows you all the information available
for the state of the current frame being rendered, like the draw alpha or fill colour. This cannot be updated in real time so you will need to pause the game to update and get the frame
details.
This watch shows you all the information available
for the state of the current frame being rendered, like the draw alpha or fill colour. This cannot be updated in real time so you will need to pause the game to update and get the frame
details.
Surfaces / TexturesSurfaces / Textures
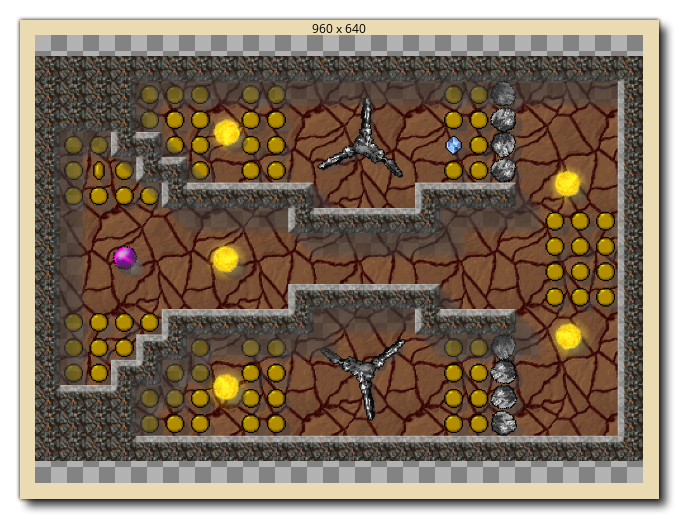
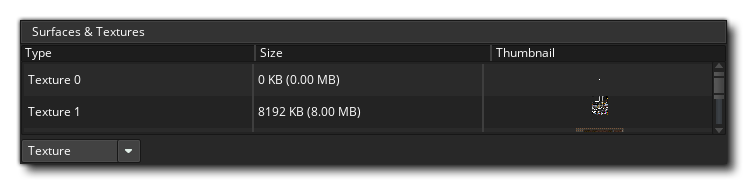 This watch enables you to see
exactly what is being drawn to any surfaces you have in your game (including the application surface) as well as see the texture pages that are in memory. You can select from textures or surfaces from the menu at the bottom of the watch, and then mouse over the texture or surface ID to have it displayed in a pop-up window:
This watch enables you to see
exactly what is being drawn to any surfaces you have in your game (including the application surface) as well as see the texture pages that are in memory. You can select from textures or surfaces from the menu at the bottom of the watch, and then mouse over the texture or surface ID to have it displayed in a pop-up window:
 Note that the debugger must be paused before these will update.
This window is where you can see the current system profile for the game being tested and it's where you can check everything in your game from whole events to individual function calls to see how they are performing and spot any trouble areas or bottlenecks. For further information on profiling see the following page:
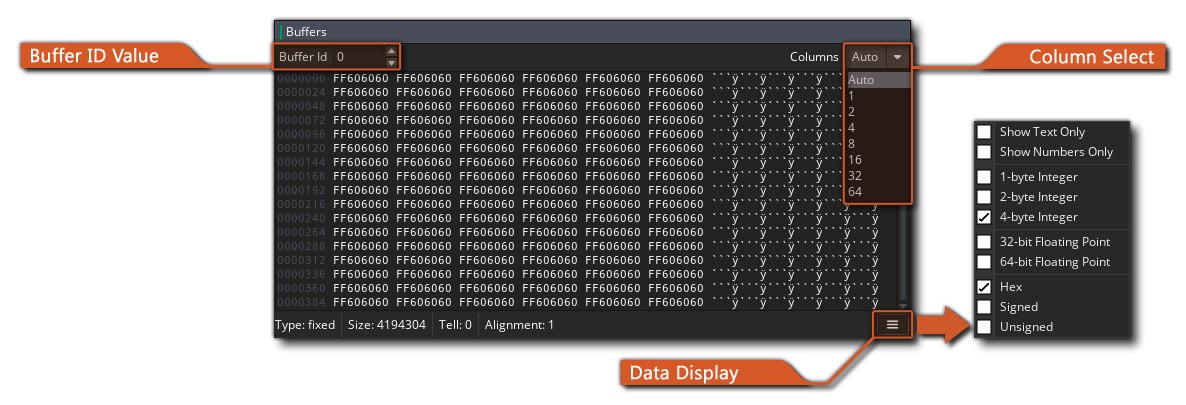
If you have initialised any buffers in your game, then this window will show you the buffer data. You can select any buffer created by setting the Buffer ID value, which will start at 0 for the first buffer created
in your game, and increment by 1 for each consecutive buffer:
 If you right click
 ![]() on the data window or click the Data Display button, you can select how the data is displayed, setting the alignment and type, and you can also set how
the data is laid out from the Column Select box. There is a drop-down window here where you can select from a default list of layouts.
on the data window or click the Data Display button, you can select how the data is displayed, setting the alignment and type, and you can also set how
the data is laid out from the Column Select box. There is a drop-down window here where you can select from a default list of layouts.